
Representation of Discrete Data
Representation of Discrete Data: Overview
This topic covers concepts, such as, Stem and Leaf Method in Statistics, Merits and Demerits of Stem-and-Leaf Plot, Reading the Data in Tabular Form & Reading and Analyzing the Data etc.
Important Questions on Representation of Discrete Data
Refer the table below and answer the following questions related to the table.
The following tables give the data on human impact by region caused by disasters.
Disasters with a Natural trigger (Number of People)
| Killed | Injured | affected | homeless | |
| Africa | 76485 | 1017 | 11450827 | 256871 |
| America | 8988 | 15180 | 4487691 | 308359 |
| Asia | 55922 | 37288 | 111473882 | 4334807 |
| Europe | 2240 | 3475 | 561580 | 64965 |
| Oceania | 94 | 135 | 653827 | 14077 |
| Total | 143729 | 57095 | 128627807 | 4979079 |
Disaster with a Non- Natural Trigger (Number of people)
| Killed | Injured | affected | homeless | |
| Africa | 590 | 256 | 3526 | 2384 |
| America | 3775 | 1044 | 49363 | 1734 |
| Asia | 2326 | 5712 | 41575 | 6359 |
| Europe | 906 | 535 | 9099 | 7784 |
| Oceania | 20 | 486 | 11410 | 64 |
| Total | 7617 | 8033 | 114973 | 18325 |
What percentage of the impact of non natural disasters has resulted into homeless ?
Refer the table below and answer the following questions related to the table.
| sales | Expenditure | Equity | |
| 1988 | 250 | 230 | 10 |
| 1989 | 270 | 260 | 10 |
| 1990 | 310 | 290 | 15 |
| 1991 | 370 | 360 | 20 |
| 1992 | 440 | 410 | 30 |
Profit= sales - Expenditure
In which year was the ratio of expenditure to sales the lowest?
Refer to the table and answer the following questions related to the table
There are bakeries in the area that make sponge cakes and below are the compositions of each of their recipes.
| Item | Bakery | UNIT | |||||
| A | B | C | D | E | F | ||
| FLOUR | 1000 | 900 | 900 | 900 | 1000 | 1000 | Gm |
| SUGAR | 6 | 6 | 7 | 6 | 5 | 6 | Tablespoon |
| WATER | 500 | 450 | 420 | 480 | 500 | 500 | ml |
| EGGS | 3 | 3 | 3 | 3 | 2 | 2 | number |
| BUTTER | 250 | 300 | 250 | 300 | 300 | 250 | Gm |
From among the recipes, which is by weight the lowest percentage of water?
Refer to the table below and answer the following questions related to the table:
| Year | World export | Export of Developed World | Export of Developing world | Exports of Petroleum exporting nations |
| 1989 | 3000 | 2150 | 650 | 160 |
| 1990 | 3450 | 2400 | 740 | 200 |
| 1991 | 3520 | 2500 | 790 | 198 |
| 1992 | 3614 | 2650 | 850 | 210 |
Which group of nations has shown the maximum exports during to
Refer the table below and answer the following questions related to the table.
| sales | Expenditure | Equity | |
| 1988 | 250 | 230 | 10 |
| 1989 | 270 | 260 | 10 |
| 1990 | 310 | 290 | 15 |
| 1991 | 370 | 360 | 20 |
| 1992 | 440 | 410 | 30 |
Profit= sales - Expenditure
In the following years when was the ratio of profit to equity the highest ?
Refer to the table below and answer the following questions related to the table.
| sales | Expenditure | Equity | |
In which year was the ratio of profit to sales the highest?
Refer the table below and answer the following questions related to the table.
| sales | Expenditure | Equity | |
| 1988 | 250 | 230 | 10 |
| 1989 | 270 | 260 | 10 |
| 1990 | 310 | 290 | 15 |
| 1991 | 370 | 360 | 20 |
| 1992 | 440 | 410 | 30 |
Profit= sales - Expenditure
In the following years when was the ratio of profit to equity the lowest?
Refer to the table below and answer the following questions related to the table:
| Year | World export | Export of Developed World | Export of Developing world | Exports of Petroleum exporting nations |
| 1989 | 3000 | 2150 | 650 | 160 |
| 1990 | 3450 | 2400 | 740 | 200 |
| 1991 | 3520 | 2500 | 790 | 198 |
| 1992 | 3614 | 2650 | 850 | 210 |
If the petroleum exporting nations were the only nations exporting petroleum in all the years, then the petroleum exports in all the years as a percentage of total exports for the year is equal to_____.
Refer the table below and answer the following questions related to the table.
The following tables give the data on human impact by region caused by disasters.
Disasters with a Natural trigger (Number of People)
| Killed | Injured | affected | homeless | |
| Africa | 76485 | 1017 | 11450827 | 256871 |
| America | 8988 | 15180 | 4487691 | 308359 |
| Asia | 55922 | 37288 | 111473882 | 4334807 |
| Europe | 2240 | 3475 | 561580 | 64965 |
| Oceania | 94 | 135 | 653827 | 14077 |
| Total | 143729 | 57095 | 128627807 | 4979079 |
Disaster with a Non- Natural Trigger (Number of people)
| Killed | Injured | affected | homeless | |
| Africa | 590 | 256 | 3526 | 2384 |
| America | 3775 | 1044 | 49363 | 1734 |
| Asia | 2326 | 5712 | 41575 | 6359 |
| Europe | 906 | 535 | 9099 | 7784 |
| Oceania | 20 | 486 | 11410 | 64 |
| Total | 7617 | 8033 | 114973 | 18325 |
The total number of people left injured by the disasters (natural and non natural) is equal to_____
Refer the table and answer the following questions related to the table
There are bakeries in the area that make sponge cakes and below are the compositions of each of their recipes.
| Item | Bakery | UNIT | |||||
| A | B | C | D | E | F | ||
| FLOUR | 1000 | 900 | 900 | 900 | 1000 | 1000 | Gm |
| SUGAR | 6 | 6 | 7 | 6 | 5 | 6 | Tablespoon |
| WATER | 500 | 450 | 420 | 480 | 500 | 500 | ml |
| EGGS | 3 | 3 | 3 | 3 | 2 | 2 | number |
| BUTTER | 250 | 300 | 250 | 300 | 300 | 250 | Gm |
Whose recipe contains by weight, the highest percentage of flour?
Directions : In the following table the number of students passed in different subjects is given.
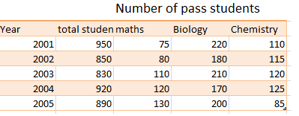
In which year minimum percentage of students pass ?
Refer the table below and answer the following questions related to the table.
| Year | World Export | Export of Developed World | Export of Developing World | Exports of Petroleum Exporting Nations |
The percentage rise in world exports between and is equal to_____.
Refer the table below and answer the following questions related to the table.
The institute placement cell conducted a survey to determine preferences of students in the various areas of specialization. The two areas tested were Finance and Marketing. The following table indicates the number of students who preferred one or both specializations.
| Prior work experience (years) | Specialization preferred | Total no. of students surveyed including those who did not prefer either specialization | ||||||
| Marketing | Finance | Both | ||||||
| Male | Female | Male | Female | Male | Female | Male | Female | |
| 0 to 1 | 180 | 60 | 240 | 180 | 90 | 45 | 420 | 270 |
| 2 to3 | 150 | 120 | 120 | 150 | 90 | 60 | 600 | 480 |
| 4 or more | 120 | 90 | 90 | 60 | 30 | 45 | 300 | 360 |
How many students with years of work experience prefer only one specialization ?
Refer the table below and answer the following questions related to the table.
The following tables give the data on human impact by region caused by disasters.
Disasters with a Natural trigger (Number of People)
| Killed | Injured | affected | homeless | |
| Africa | 76485 | 1017 | 11450827 | 256871 |
| America | 8988 | 15180 | 4487691 | 308359 |
| Asia | 55922 | 37288 | 111473882 | 4334807 |
| Europe | 2240 | 3475 | 561580 | 64965 |
| Oceania | 94 | 135 | 653827 | 14077 |
| Total | 143729 | 57095 | 128627807 | 4979079 |
Disaster with a Non- Natural Trigger (Number of people)
| Killed | Injured | affected | homeless | |
| Africa | 590 | 256 | 3526 | 2384 |
| America | 3775 | 1044 | 49363 | 1734 |
| Asia | 2326 | 5712 | 41575 | 6359 |
| Europe | 906 | 535 | 9099 | 7784 |
| Oceania | 20 | 486 | 11410 | 64 |
| Total | 7617 | 8033 | 114973 | 18325 |
As the percentage of the total impact in any region for natural disasters, the maximum injuries have occurred in which region?
Refer the table below and answer the following questions related to the table
A survey of movie goers from cities A, B, C, D and E is summarized below. The first column gives the percentage of viewers in each city who watch less than one movie a week . The second column gives the total number of viewers who view one or more movies per week
| City | I | II |
| A | 60 | 2400 |
| B | 20 | 3000 |
| C | 85 | 2400 |
| D | 55 | 2700 |
| E | 75 | 8000 |
A city with the Lowest number of movies watchers is_____.
Refer to the table and answer the following questions related to the table
There are bakeries in the area that make sponge cakes and below are the compositions of each of their recipes.
| Item | Bakery | UNIT | |||||
| A | B | C | D | E | F | ||
| FLOUR | 1000 | 900 | 900 | 900 | 1000 | 1000 | Gm |
| SUGAR | 6 | 6 | 7 | 6 | 5 | 6 | Tablespoon |
| WATER | 500 | 450 | 420 | 480 | 500 | 500 | ml |
| EGGS | 3 | 3 | 3 | 3 | 2 | 2 | number |
| BUTTER | 250 | 300 | 250 | 300 | 300 | 250 | Gm |
If one assumes that a cake loses of its water and of its butter during the banking process, then which cake will be the lightest after banking?
Let the marks obtained by students of class in a class test, out of according to their roll numbers, be: , represent the given data in tabular form using rows and columns.
Let the marks obtained by students of class in a class test, out of according to their roll numbers, be: , represent the given data in tabular form.
Let the marks obtained by students of class in a class test, out of according to their roll numbers, be: , represent the given data in tabular form using rows and columns and find the number which occurs most.
Arrange the following data in descending order.


